Financial Performance Analysis Between ASX Listed Woodside Energy (WDS) and Metcash (MTS)
A comprehensive financial analysis and investment appraisal in Microsoft Excel, comparing Woodside Energy and Metcash using financial ratios, Altman Z-Scores, share-price forecasting, dashboards, and capital budgeting techniques.
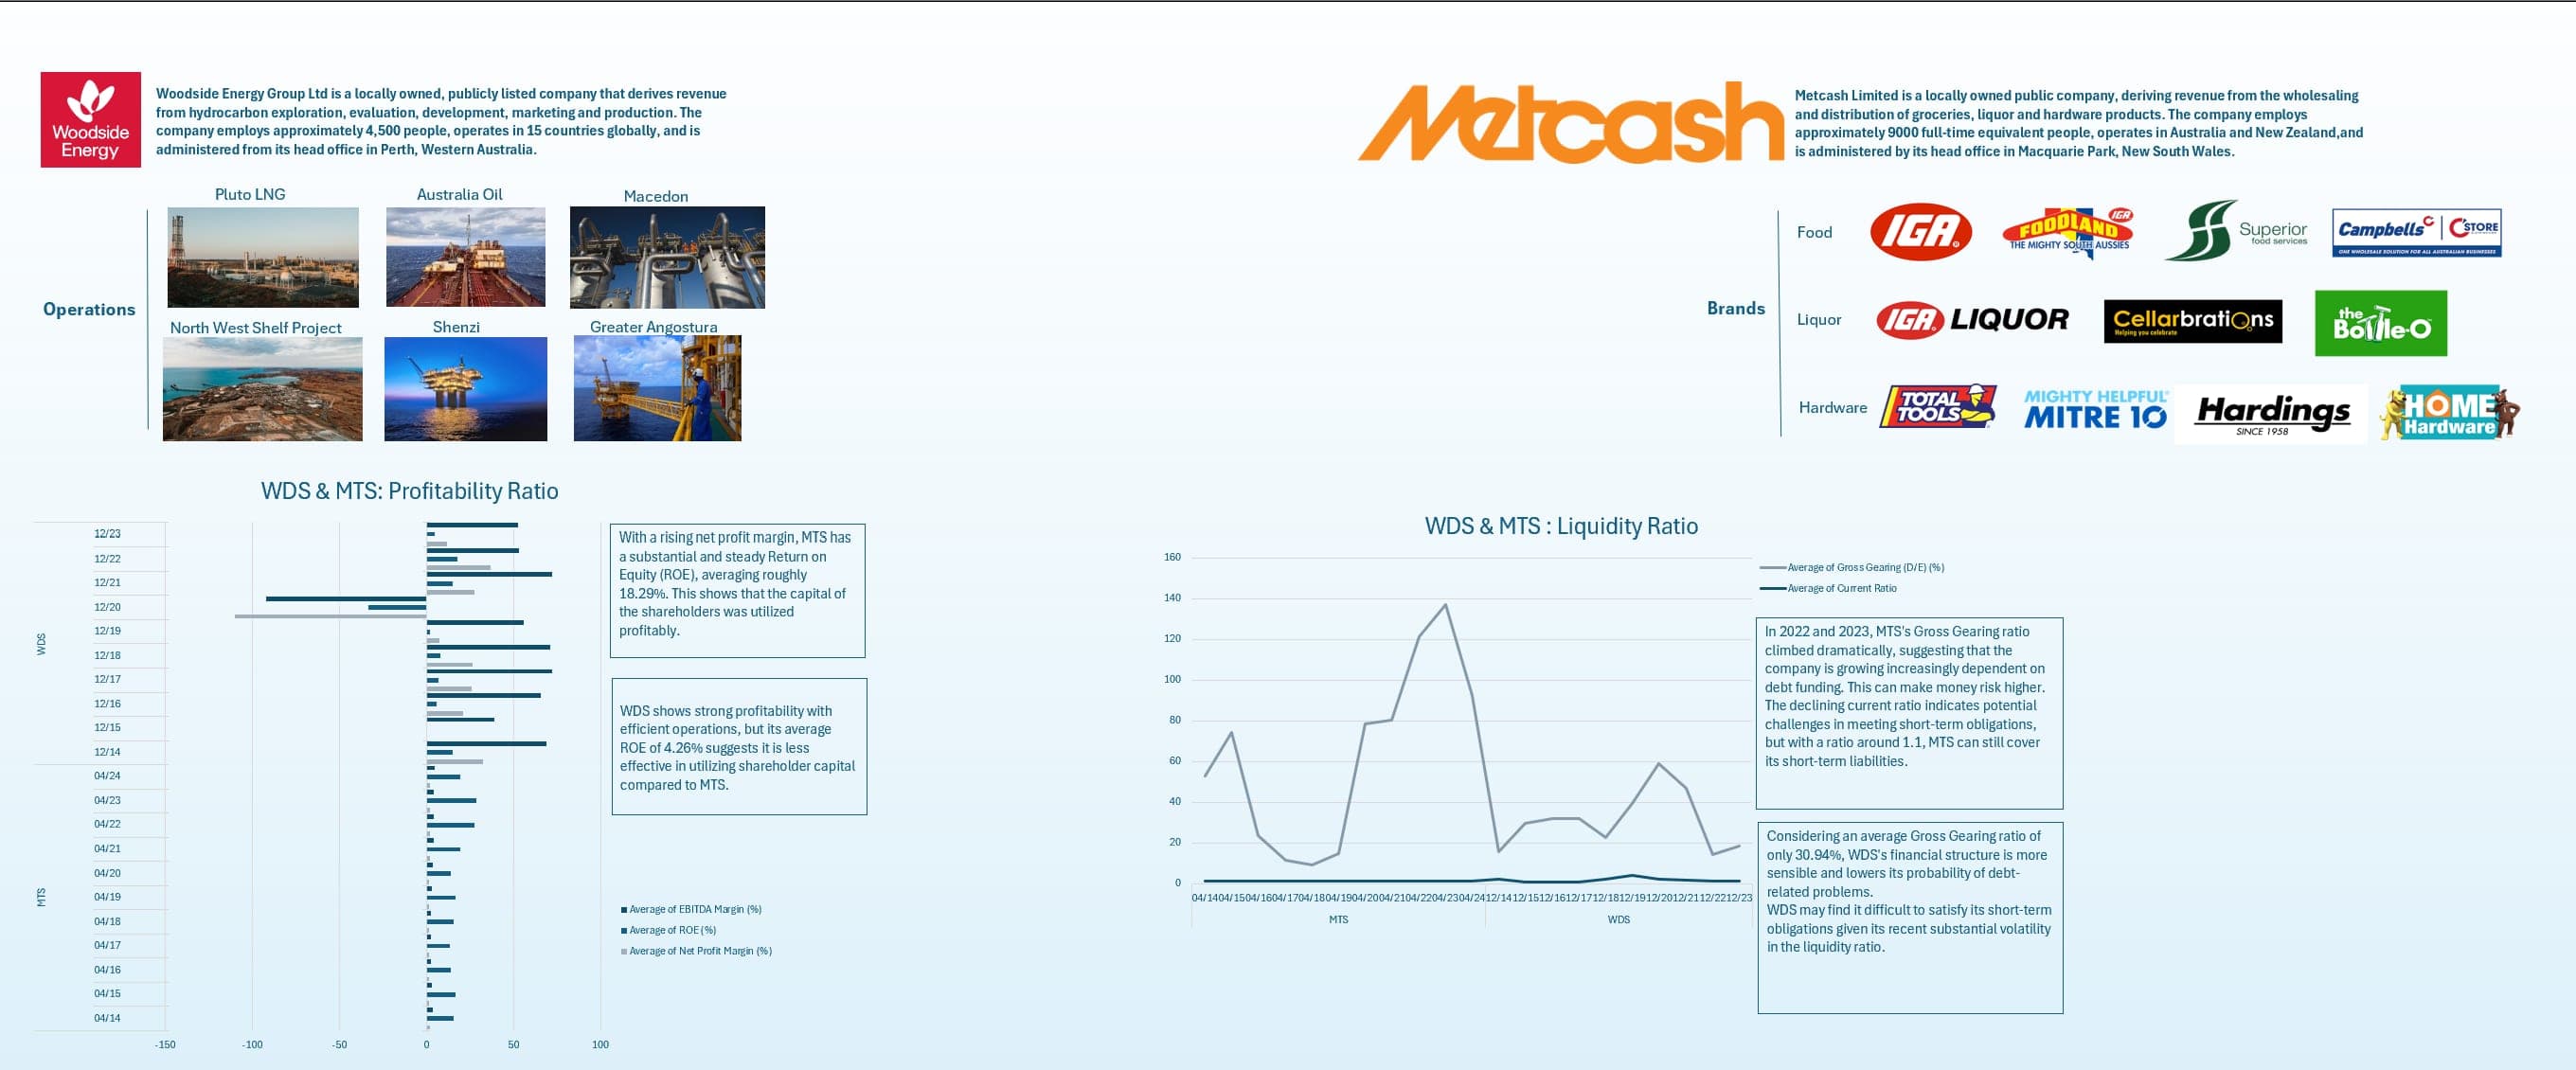
The brief
A multi-year comparative analysis of two ASX-listed companies from different sectors, built from historical financial statements to assess relative performance and financial health.
The work covered profitability, liquidity, and gearing — net profit margin, ROE, EBITDA margin, and current ratio — tracked across several years to show direction rather than a single snapshot. Applied the Altman Z-Score model to both companies to assess financial distress risk over time, and analysed historical share-price data to examine potential future price movements.
Built an interactive Excel dashboard using PivotTables, charts and slicers so the two companies could be compared across metrics and periods without rebuilding the analysis each time.
A separate capital investment appraisal compared alternative projects using Payback Period, Discounted Payback, NPV, IRR, MIRR and Profitability Index — including where the ranking under IRR diverged from NPV.
Tools: Excel · PivotTables and slicers · Ratio analysis · Altman Z-Score · DCF techniques