Sales & Profitability Analysis Report of Superstore Limited
Interactive Power BI dashboard to analyse Superstore Ltd’s sales, profitability, customers, products, and regional performance and identify opportunities for business improvement.
The brief
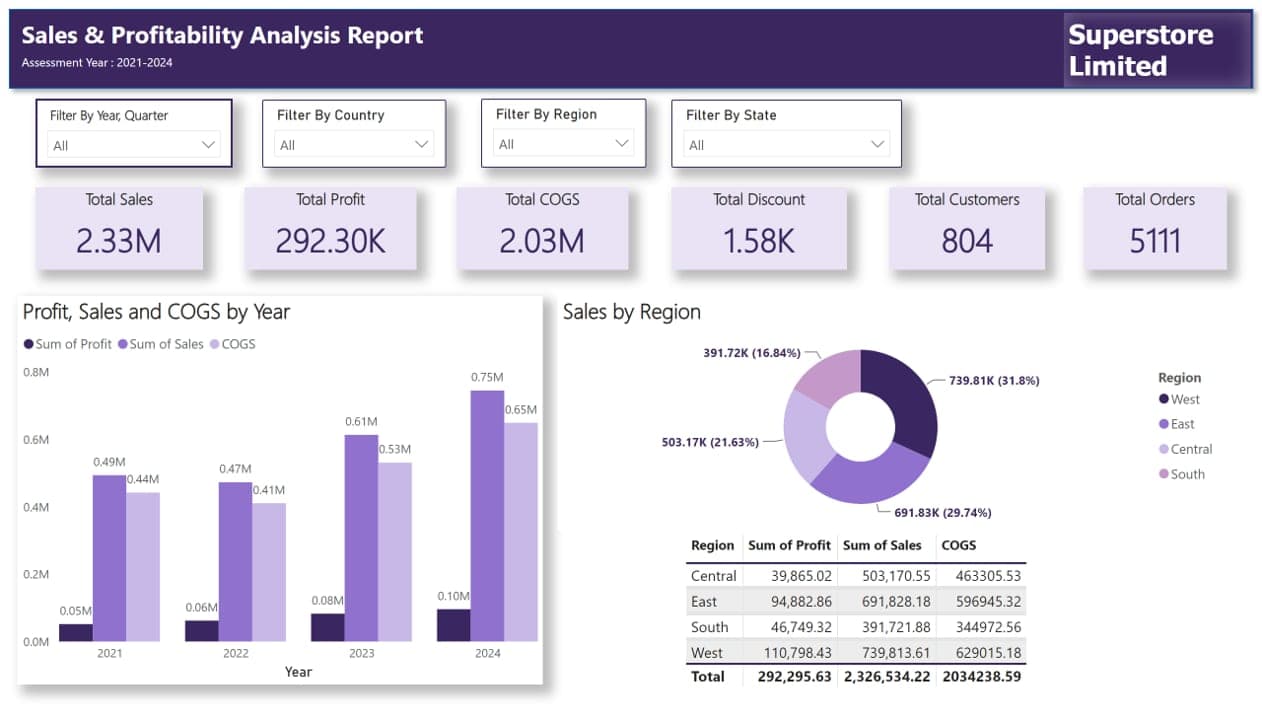
A four-page interactive dashboard analysing sales and profitability across the Superstore dataset, built to answer the question a manager actually asks: where are we making money, and where are we losing it?
The report breaks performance down by sales, customers, products, and region, with calculated measures for total sales, profit, COGS, discounts, customer counts, and order volume. Slicers for year, quarter, country, region, and state let a user move from a national view to a single state without leaving the page.
The analysis surfaced trends and underperforming areas that pointed to specific commercial recommendations — including where discounting was eroding margin rather than driving volume.
Tools: Power BI · DAX measures · KPI cards, bar and pie charts, maps, tables